
It would be a sheer waste of time to discuss the benefits of visualization tools such as charts in this post, as we have a curated post regarding different types of charts and its uses. If you haven’t gone through that, our advice is to look at it and then come back and start reading from here. For starters it is the key element while visualizing and analyzing complex data to get to important decision in a quick and precise way.
Well there are two ways to insert a pivot chart. You can insert a pivot chart directly from a regular table or you can use a pivot table to insert a pivot chart.
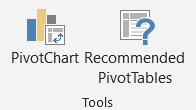
To Create a PivotChart
- Select a cell in your table.
- Select Insert > PivotChart
.
- Select OK.
To Create a chart from a PivotTable
- Select a cell in your table.
- Select PivotTable Tools > Analyze > PivotChart
- Select a chart.
- Select OK.
Let us see an example walkthrough so that you can understand the process clearly.
Let us make a frequency distribution chart using Pivot Table.
Frequency Distribution (Pivot Charts)
It’s as easy as making normal excel charts but they can provide valuable quick information when you do not want to disturb the main table and hence use the pivot table for data analysis which can provide greater features than a normal table.
Steps:
- Click on any cell of Pivot Table
- Go to Pivot table tools -> Analyse -> PivotChart
- Click on the Clustered Column chart and the Click on OK

We now have a frequency distribution Chart.
Remember that the data inside the pivot table should contain counts and you should format accordingly.
You can also remove certain unwanted elements from the charts by clicking on the City options which can hide certain cities if they are not necessary for your analysis.
Off course, your data will be different but the underlying concept is the same.

In a similar way you can insert any type of pivot chart which you want to effectively visualize your data so that you can create insights from it.
You can choose from a number of chart options like Column, Area, Bar, Pie, Histograms, etc., into your sheet.
Hope you find this post informative.
Keep Learning!
Source:
https://support.microsoft.com/en-us/office/create-a-pivotchart-c1b1e057-6990-4c38-b52b-8255538e7b1c