
Let us know about importance of pivot tables. But before we get to know about pivot, what is pivot table?
What is a Pivot Table in Excel?
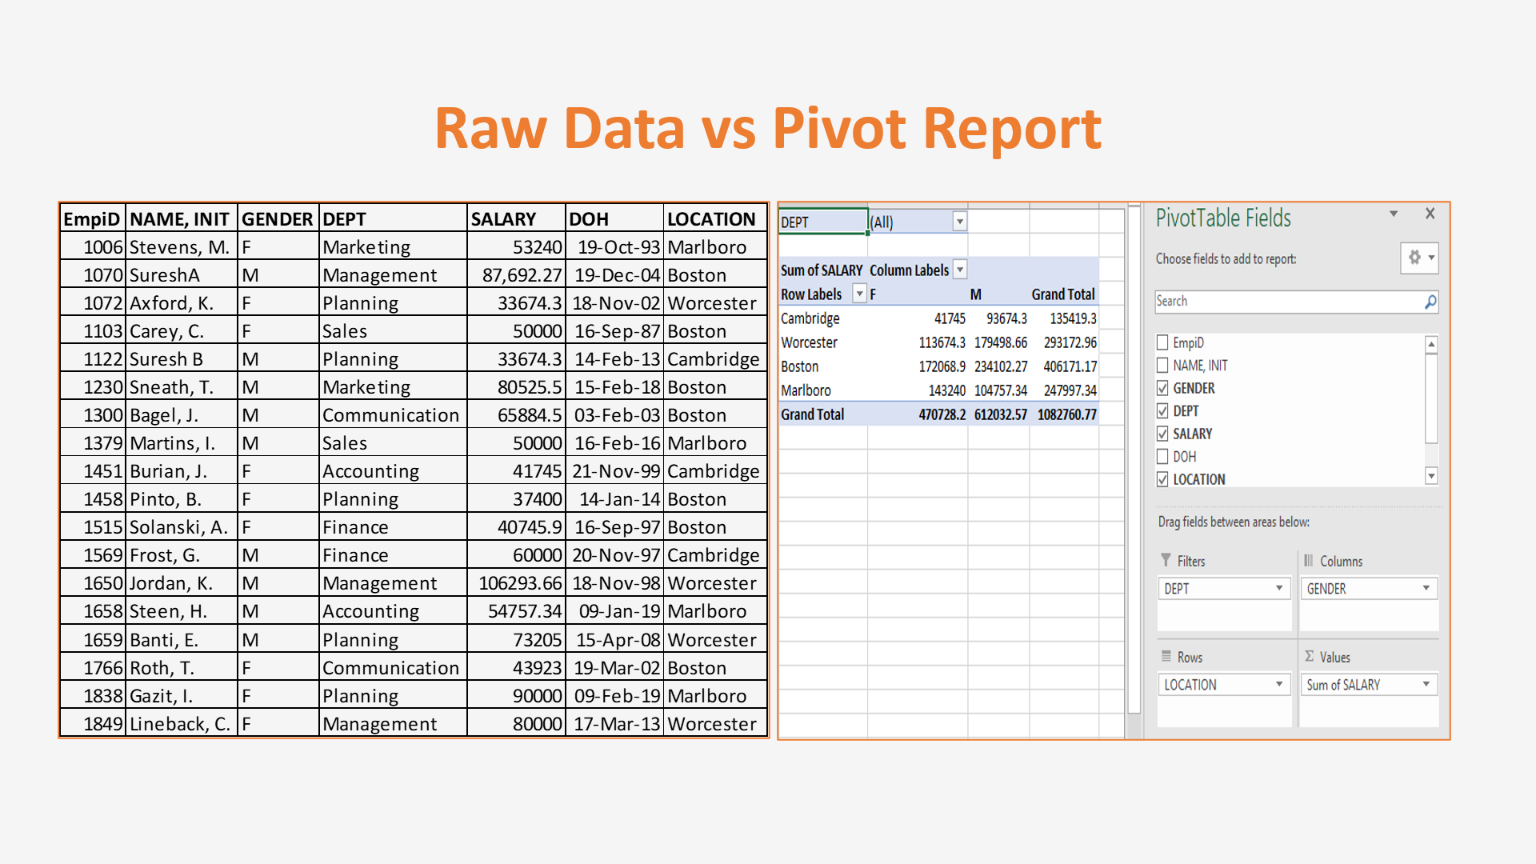
A Pivot Table is a Data Processing technique in which a table is generated that Summarizes the data from other tables by the use of statistical functions like sum, average, etc. to provide meaningful representation and references.
Pivot table helps the user to expand, isolate, sum, and group the particular data in real time. It can show you the differences in very big data sets and helps in organization of large amounts of data in Excel.
Pivot table consists of columns, rows, pages, and data fields. It can help you in efficient analysis of large data and draw up conclusions from the data being shown by pivot tables.
Importance of Pivot Tables

- Instant Data creation in easy way using Pivot Tables

Pivot tables are very user friendly and easy to use. You can easily summarize data by dragging the columns to different sections of the table. The columns can also be rearranged as you wish with the click of a mouse.
And with this tool, a user can easily compare information in a few seconds. It can be helpful when you are going to meet a deadline or in any other time constrained environment where you have to publish reports daily to support your organization’s work.
- Data Analysis made easier using Pivot Tables

Analysing data becomes very efficient when you create pivot tables. Pivot tables can group your data and hide unrelated data to show only the relevant ones to make your data analysis task much easier and effective.
Pivot tables can handle a large amount of data and analyse them faster. The tables allow a user to drag and drop data with ease and the data table becomes interactive.
- Summarization of Data

Pivot tables which are built in features of Microsoft Excel provide a quick and easier approach for summarizing large chunks of Data. Summarization of data makes it easier to understand the concept behind the data.
Those end-users who are not responsible for the creation and administration of a database can also easily understand the summarized data.
With this tool, rows and columns can be labelled and sorted in any way that a user wants to and data can be arranged according to their needs and how they want it to be presented.
- Find Data Patterns

It is very hard to predict or forecast something by just looking at tabular data. You need to visualize or process the data before any data analysis to be done on that particular data set. Then by studying the processed data one can come to a conclusion for a data pattern being present in the data set.
Pivot tables in Excel provides very powerful features to find such data patterns which can be very useful to determine your:
- target consumer’s demographics,
- Or your targeted audience or
- you can come up with something unique which can prove to be a beneficial step to your organization’s/business’s growth.
- Accurate and Quick Report Generation

Pivot tables can save your precious time by automatically preparing eye-catchy reports. You don’t have to sit hours compiling and making the report manually.
Pivot tables drag n drop feature in organizing data provides great flexibility in arranging relevant data to produce accurate and meaningful reports quickly.
Several reports can be created from pivot tables with the support of a single database saving you time in Copying and Pasting data.
- Fast Decision Making

Pivot tables can play a very important role in decision making. This tool can provide great insights for Entrepreneurs and Business Leaders who thrive on quick decision making.
Conclusion
Pivot Tables are a great way of Data collection, analytics which provide Summaries, quick and Accurate reports to help with important organizational or business decisions. Know how to group, sort, filter and slicers in pivot tables.