Microsoft Excel inserts automatic page breaks based on the paper size, margin, settings and scale options. You can manually set a page break wherever you like for printing purposes. Also, you can change the page layout to your liking and your work flow. You can insert formulas to automate your complex arithmetic calculations and other mathematical as well as statistical tasks. You can analyse and review your data through the data analysis features of Excel. This post is a comprehensive guide to do these basic tasks to help you achieve greater results from Microsoft Excel.
Page Breaks
Page breaks are dividers that break a worksheet into separate pages for printing. Microsoft Excel inserts automatic page breaks based on the paper size, margin settings, scale options, and the positions of any manual page breaks that you insert. To print a worksheet with the exact number of pages that you want, you can adjust the page breaks in the worksheet before you print it.
Insert a page break
- Click the worksheet that you want to print.
- On the View tab, in the Workbook Views group, click Page Break Preview.
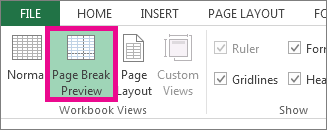
You can also click Page Break Preview on the status bar.
- Do one of the following:
- To insert a vertical page break, select the row below where you want to insert the page break.
- To insert a horizontal page break, select the column to the right of where you want to insert the page break.
- On the Page Layout tab, in the Page Setup group, click Breaks.

- Click Insert Page Break.
You can also right-click the row or column below or to the right of where you want to insert the page break, and then click Insert Page Break.
If manual page breaks that you insert do not take effect, it may be that the Fit To scaling option has been selected on the Page tab of the Page Setup dialog box (Page Layout tab, Page Setup group, Dialog Box Launcher ). To use the manual page breaks, change the scaling to Adjust to instead.
Move a page break
Important: To enable dragging of page breaks to another location in a worksheet, make sure that the cell drag-and-drop feature is enabled. If this feature is not enabled, you may not be able to move any page breaks.
- To verify that drag-and-drop is enabled, do the following:
- Click the File tab > Options. In Excel 2007, click Microsoft Office Button
, and then click Excel Options.
- In the Advanced category, under Editing options, select the Enable fill handle and cell drag-and-drop check box, and then click OK.
- Click the File tab > Options. In Excel 2007, click Microsoft Office Button
- Click the worksheet that you want to modify.
- On the View tab, in the Workbook Views group, click Page Break Preview.
You can also click Page Break Preview on the status bar.
- To move a page break, drag the page break to a new location.
Note: Moving an automatic page break changes it to a manual page break.
Layout and Formulas
What is Page Layout and its uses?
The page Layout tab is very useful for setting the page as we want for printing purposes. You can set the margins of the sheet you are working on. You can set the Orientation of the Sheet and many other options are there which we will discuss now:

In this Page Layout tab, we have 5 groups: –
- Themes: – This option is used to change the theme of the workbook by just clicking a button. Each theme has 12 colour schemes, their own fonts, SmartArt and the effects for shape. Also, you can customise and create a theme to your liking. You can set the colour scheme of your excel sheet to represent different sets of data if a particular colour gives more clarity to the data then select that colour scheme. Also, you can set the font styles as well as the effects in the fonts and effects drop down menu.
- Page Setup: – Page setup is where you set the final layout of the page which you would like to print or Export it (PDF or a web file) as per your requirement. You can set up the margins to be narrower or wider. You can change the orientation to be portrait (suitable for prints) or Landscape (for Web or personal viewing). You can select the size of the sheet under the ‘Size’ option which includes various paper sizes. Also, you can select the print area of your workbook. Page Breaks is already discussed in our top section. For greater customisation you can choose a suitable background if it is relevant to your worksheet. Also, there is an option to just print the tables for reference purposes.

- Scale to Fit: -This option helps to fit the page for printing by shrinking or enlarging its size to better fit the pages. We can use Scale to fit to adjust the width and height by describing the scale percentage.

- Sheet Options: – This option helps you to retain Gridlines or Headings to be printed in your final print. If you uncheck these option Gridlines and Headings will not be printed.

- Arrange: -We use this option to arrange the objects back and forward to align it. Also, we have Selection pane option by which we can see total images in the workbook and select them from there.

Excel Formulas
What is a formula?
A formula in Excel is an expression that returns a specific result. For example:
=1+2 // returns 3

Cell references
In the above example, values were “hardcoded”. That means results won’t change unless you edit the formula again and change a value manually. Generally, this is considered bad form, because it hides information and makes it harder to maintain a spreadsheet.
Instead, use cell references so values can be changed at any time. In the screen below, C1 contains the following formula:
=A1+A2+A3 // returns 9

Notice because we are using cell references for A1, A2, and A3, these values can be changed at any time and C1 will still show an accurate result.
How to enter a formula
To enter a formula:
- Select a cell
- Enter an equals sign (=)
- Type the formula, and press enter.
Instead of typing cell references, you can point and click cells to add. Note references are color-coded:
All formulas in Excel must begin with an equals sign (=). No equals sign means excel will process it as a simple value and no formula:

Math Operators
+Addition=2+3=5-Subtraction=9-2=7*Multiplication=6*7=42/Division=9/3=3^Exponentiation=4^2=16()Parentheses=(2+4)/3=2 |
The table below shows the standard math operators available in Excel:
The above table consists of the math operators supported while writing excel formulas.
Formulas are a key element for an efficient database maintenance sheet. Without formulas the amount of manual work required will be huge. Always use formulas to efficiently tackle your worksheet challenges.
Now only on the topic: Formulas a whole mini book can be written. There are basic functions such as sum, max, min, avg, count, etc. There are advanced formulas and functions for the power users of Excel. We will discuss about formulas in a specific post geared towards just the Formulas.
Data Review
There is always a lot to admire about excel. Excel not only does basic computations for you, it can provide a wide range of tools for data visualization, analysis and review.
It is widely used for many purposes including the likes of financial modelling and business planning. It can become a good stepping stone for people who are new to the world of business analytics.
Even before learning advanced data analysis techniques using Python or R one should learn excel as adding an extra skill doesn’t harms anyone. Excel, with its wide range of functions, visualizations, and arrays empowers you to quickly generate insights from data which would be hard to see otherwise.
This section illustrates the powerful features Excel has to offer to analyse data.
- Sort: You can sort your Excel data on one column or multiple columns. Sorting can be applied in Ascending or Descending order as per the relevance
- Filter: Filter is a powerful tool to display only the required information from your tables by applying a criterion to filter out the data on the basis of the condition provided.
- Conditional Formatting: Conditional formatting in Excel enables you to highlight cells with a certain colour, depending on the cell’s value.
- Charts: Visual Data is easy to understand. Excel provides a variety of chart options to make your data stand out and make inferences from your data. The charts can be Pie chart, Bar chart, Histograms, etc. which can display complex data in a graphically engaging way.

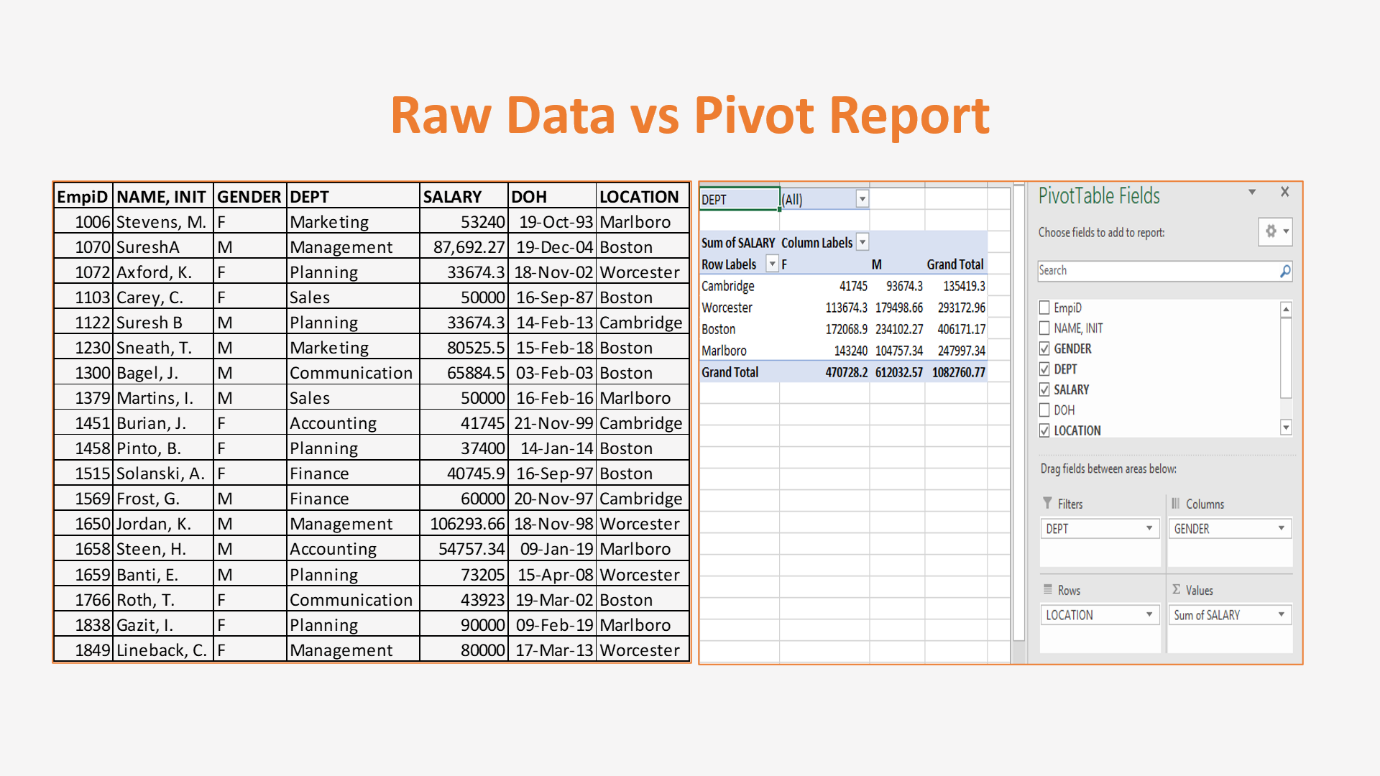
- Pivot Tables: Pivot tables are used to summarize, sort, reorganize, group, count, total or average data stored in a database. It allows its users to transform columns into rows and rows into columns. It allows grouping by any data field. Pivot tables are one of Excel’s most powerful features. A pivot table allows you to extract the significance from a large, detailed data set. You can think of a pivot table as a report. However, unlike a static report, a pivot table provides an interactive view of your data. With very little effort.
- Tables: Tables allow you to analyse your data in Excel quickly and easily. Tables are highly effective medium of visualizing data. Even a child can understand what a table is intended for and what it says. Tables are the simplest way to give out detailed information on a certain data.

- What-If Analysis: What-If Analysis in Excel allows you to try out different values (scenarios) for formulas.
We have discussed a lot about data analysis and review tools for Excel. After reading all of this you must be excited to learn about these things. To kick start your career in the field of data analytics join our flagship training program for Microsoft Excel. And get a chance to land a job in the most demanded job category which is also termed as the sexiest job of the 21st century.
Views and Help
Views Tab

Again, this tab gives you a variety of tools to choose from to customise the view you want your spreadsheet to be displayed.
Whether you want to display the ruler, gridlines or the formula bar it is your choice in the way you are most comfortable to work with.
Also, you can zoom in or zoom a selection (a part) of your sheet. You can arrange, split as well as hide selections. There is an option to switch windows and an option for macros which is very useful.
If you have tasks in Microsoft Excel that you do repeatedly, you can record a macro to automate those tasks. A macro is an action or a set of actions that you can run as many times as you want. When you create a macro, you are recording your mouse clicks and keystrokes.
Some Tips for different Views
- Although you can work with page breaks in Normal view, we recommend that you use Page Break Preview view to adjust page breaks so that you can see how other changes that you make (such as page orientation and formatting changes) affect the automatic page breaks. For example, you can see how a change that you make to the row height and column width affects the placement of the automatic page breaks.
- To override the automatic page breaks that Excel inserts, you can insert your own manual page breaks, move existing manual page breaks, or delete any manually-inserted page breaks. You can also quickly remove all the manually-inserted page breaks. After you finish working with page breaks, you can return to Normal view.
In Page Break Preview, dashed lines are page breaks Excel automatically added. Solid lines are page breaks that were added manually.

Help in Excel

Help in excel is a useful feature when you are struck in something you don’t know. Just click on the help button and a right pane with a help window will come.

Just start to type the problem in the search bar and you will get results on how to do that thing if it already exists.
Or you can just contact the Microsoft Support to get help with your problems. Additionally, you can check out the official Excel blog to have a track of latest features and releases.

Class-room of your choice
Upskill yourself by attending classroom or online class.

Flexible timings
Learn at your convenient time. We have a flexible schedule, which is designed to suit your learning style and pace.

Class-Room Size
With limited students in class, attention to each student's performance will be given.

Industry Ready Curriculum
The course is designed for people who want to work in the industry.